


Try Our Free WBGT Calculator
Estimate WBGT in seconds using live weather data.
What is WBGT?
Definition
Wet Bulb Globe Temperature (WBGT) is a composite heat stress index that measures how the human body experiences heat in direct sunlight. It accounts for air temperature, humidity, wind speed, cloud cover, and solar radiation — making it the most complete picture of outdoor heat stress available.
Unlike the heat index, which only considers temperature and humidity in the shade, WBGT reflects real-world outdoor conditions. It’s the index used by the U.S. Military, OSHA, NFHS, and other governing bodies because it more accurately predicts when heat becomes dangerous — even for healthy, fit people.
Think of WBGT as your body’s true heat load, not the number on a thermometer. On a sunny, humid, windless day, your WBGT could be 10–15°F higher than the air temperature alone would suggest.
What does WBGT measure?
WBGT combines readings from three thermometer types, each capturing a different driver of heat strain. Together, they represent every meaningful way your environment adds heat load to your body.
Natural Wet Bulb Temp
70% weight
Measures evaporative cooling capacity — how effectively sweat can cool your skin based on humidity and airflow. The most influential component because sweating is the body’s primary cooling system.
Globe Temperature
20% weight
Measured inside a black globe thermometer, this captures radiant heat — direct solar radiation plus heat radiating from hot surfaces like turf, concrete, or pavement.
Dry Bulb Temperature
10% weight
Standard air temperature measured in the shade. This is the number most people see on a thermometer or weather app — and it’s only 10% of the WBGT equation.
How to Calculate Wet Bulb Globe Temperature
WBGT is calculated using a weighted sum of those three temperature components. The formula below is the outdoor (direct sunlight) version — the standard used in athletics and occupational settings.
Outdoor WBGT Formula (Direct Sunlight)
WBGT = 0.7 × Tnwb + 0.2 × Tg + 0.1 × Tdb
Tnwb
Natural Wet Bulb Temperature — humidity + wind effect on evaporative cooling
Tg
Globe Temperature — radiant heat from the sun and surrounding surfaces
Tdb
Dry Bulb Temperature — standard air temperature in the shade
The 70/20/10 weighting is intentional. Humidity’s impact on your ability to sweat — and therefore cool down — far outweighs the other factors. That’s why a humid 85°F day can produce a more dangerous WBGT than a dry 95°F day.
Indoor/Shade Formula: When measuring heat stress out of direct sunlight (indoors, covered areas, shade), the formula drops the globe component: WBGT = 0.7 × Tnwb + 0.3 × Tdb. The heat index is more appropriate in these environments.
WBGT vs Heat Index
Both indices estimate how hot it feels to your body. But they’re designed for different environments — and confusing them can lead to dangerous decisions.
Read the full WBGT vs Heat Index comparison →
WBGT Risk Categories: Why the Same Number Means Different Things
A WBGT of 88°F in Minnesota and a WBGT of 88°F in Louisiana are not equally dangerous. The same reading carries different risk depending on where you are — because acclimatization level varies by region.
The NFHS and ACSM divide the U.S. into three risk categories based on typical heat and humidity exposure. These categories calibrate activity modification thresholds to local conditions, accounting for the fact that people in hotter, more humid climates are physiologically better adapted to handle sustained heat load.
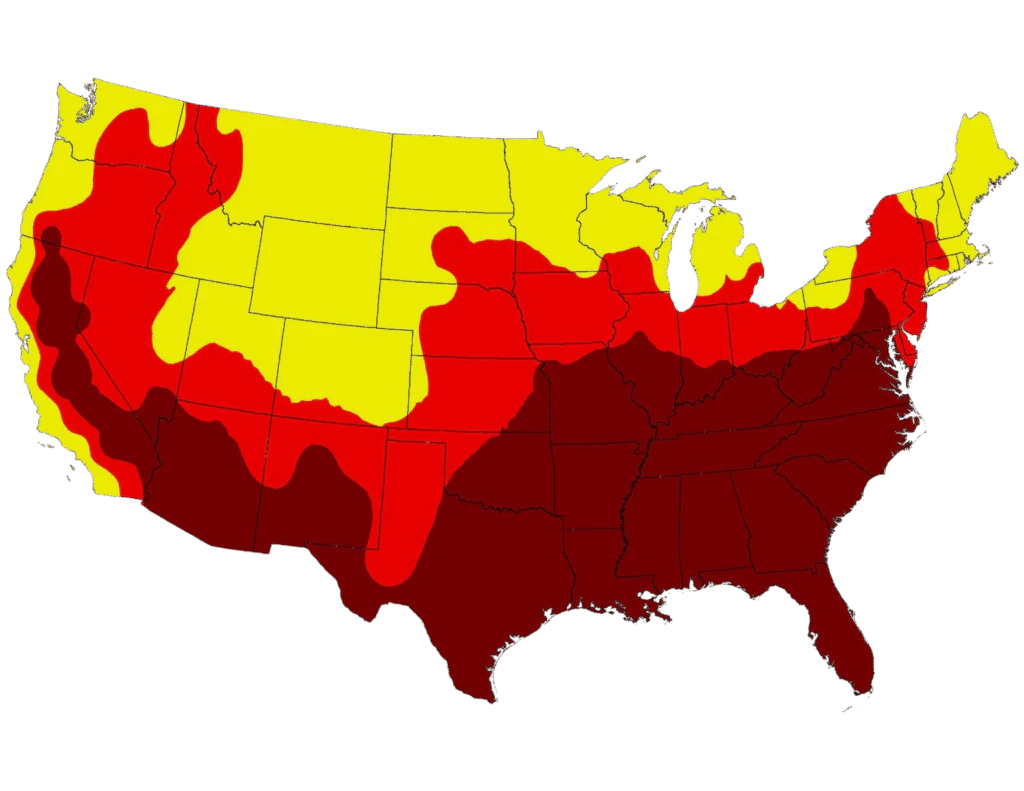
Class 1 — Cutoff 29°C (84°F)
Northern states, mountain regions, and Pacific Northwest. Lower baseline heat and humidity means less physiological adaptation across the population. The same WBGT reading here is more dangerous than in a Class 3 state — thresholds are set most conservatively to protect less acclimatized populations.
Class 2 — Cutoff 31°C (88°F)
Mid-Atlantic, Midwest, Southwest, and Central U.S. Moderate baseline heat exposure with significant seasonal swings. Early-summer acclimatization gaps are common — workers and athletes may be fully acclimatized by August but carry elevated risk at the same WBGT levels in June.
Class 3 — Cutoff 32.3°C (90°F)
Southeast, Gulf Coast, and South Texas. High baseline heat and humidity year-round. People who live and work here are more physiologically acclimatized, so activity thresholds are calibrated to reflect that.
Why Acclimatization Changes the Risk Equation
Acclimatization is your body’s physiological adaptation to sustained heat exposure — improved sweat efficiency, increased plasma volume, lower core temperature at rest. It takes roughly 10–14 days of heat exposure to develop meaningful acclimatization, and it degrades within days once exposure stops.
This matters for anyone responsible for outdoor safety, not just athletics:
- A construction crew starting work in July after a cool spring faces the same acclimatization gap as a football team in August two-a-days
- Outdoor event staff, grounds crews, and utility workers returning from time off carry elevated risk at any WBGT level
- Military trainees in new geographic regions face compounded risk from both category mismatch and individual deacclimatization
- Early-season readings — even moderate WBGT values — are statistically more dangerous than the same reading mid-season
WBGT Activity Guidelines
WBGT is most powerful as a decision-making tool. Once you have a reading, this chart — based on ACSM guidelines adopted by NFHS, many commercial organizations, and other governing bodies — tells you exactly what to do.
Cat 1 = Southeast/Gulf Coast · Cat 2 = Mid-Atlantic/Midwest/Southwest · Cat 3 = Northern states/Mountain/Pacific Northwest. Source: Grundstein et al. (2015), Applied Geography.
How to Measure WBGT
Not all WBGT measurement methods are equal. Here are the four main options, ranked from least to most accurate and scalable.A construction crew starting work in July after a cool spring faces the same acclimatization gap as a football team in August two-a-days
Weather Apps & Online Calculators
Most use the Stull method — a mathematical estimate based only on temperature and humidity. They pull data from the nearest National Weather Service station, which could be 5–25 miles from your location. No solar radiation. No local wind. Often off by 8–15°F WBGT on sunny days.
Pro: Free and convenient Con: Not accurate enough for safety compliance; no site-specific data
Handheld WBGT Devices (e.g., Kestrel)
Purpose-built instruments that directly measure WBGT components. More accurate than apps, but they require someone to carry and operate them — and stop to take readings. Small black globe sensors cause erratic spikes; most lack proper radiation shielding.
Pro: Portable; measures key components
Con: Manual process; prone to user error; no automated logging or alerts
Automated On-Site Station (Perry Weather)
A permanent on-site sensor array that directly measures all WBGT components — including a calibrated black globe, radiation-shielded wet bulb, and anemometer — and logs readings every 5 minutes automatically. Policy-based alerts fire instantly when thresholds are crossed. No manual intervention required.
Pro: Accurate, continuous, compliant, and fully automated Con: Requires installation; not portable
Click here to learn more about Perry Weather on-site WBGT monitoring →
WBGT isn’t a new concept — the military has used it since the 1950s, and every major athletic governing body has adopted it as the standard for heat safety decisions. What’s changed is accessibility. For most of that history, getting an accurate WBGT reading required trained personnel, specialized equipment, and manual logging every 15–30 minutes. That’s not realistic for a school athletic department, a construction site, or a golf course running operations across multiple locations.
That’s the problem Perry Weather solves. A permanent on-site station removes the human variable entirely — continuous readings, automatic alerts, and a full data log that documents every threshold crossing. When a heat illness incident happens and the question becomes “what did you know and when did you know it,” that record matters.
The science of WBGT is settled. The guidelines exist. The only remaining question is whether your organization has the tools to act on them — before conditions become dangerous, not after.
Frequently asked WBGT Questions
What does WBGT stand for?
WBGT stands for Wet Bulb Globe Temperature. The name reflects its three measurement components: the wet bulb thermometer (which measures evaporative cooling), the globe thermometer (which measures radiant heat), and the dry bulb thermometer (standard air temperature).
Is WBGT the same as heat index?
No. The heat index measures perceived temperature based on air temperature and humidity in the shade. WBGT measures heat stress in direct sunlight, incorporating solar radiation, wind, and cloud cover. WBGT is the appropriate metric for outdoor athletics and occupational safety. Heat index is better suited for shaded or indoor environments.
Can I use a phone app to measure WBGT?
Apps can provide a rough estimate, but they’re not suitable for official compliance. Most apps use a temperature + humidity approximation that ignores solar radiation and wind — the two factors that most often make outdoor WBGT dangerous. They also pull from NWS stations miles away from your location. For compliant WBGT monitoring, on-site measurement is required.
Who is required to monitor WBGT?
WBGT monitoring is required or strongly recommended for high school and collegiate athletic programs, OSHA-regulated outdoor workplaces, U.S. Military training, construction and outdoor labor, and any organization following NFHS heat safety guidelines.
Several states now mandate WBGT monitoring for all high school athletic programs.
What’s the difference between wet bulb temperature and wet bulb globe temperature?
Wet bulb temperature (Tw) is just one input into the WBGT formula — it measures how much evaporative cooling is possible given the current humidity and airflow. Wet bulb globe temperature (WBGT) is the full heat stress index that combines wet bulb temperature with globe temperature and dry bulb temperature. WBGT is always the appropriate metric for outdoor heat safety decisions. Full comparison →
Are heat index and wet bulb globe temperature the same?
No. WBGT is best used outside any building, athletic center, or any area that is climate controlled. Heat index, on the other hand, is best used within any building, athletic center, and casual, shaded environments. Learn more here.


