


Wet bulb globe temperature (WBGT) policy exists in some form in nearly every state today, and almost none of that happened by coincidence. It traces back to a single state that had already lost too many kids, a researcher who didn’t trust a policy that let every school set its own rules, and a six-year study that turned out to be one of the most consequential pieces of field research in sports medicine.
Perry Weather brought together Dr. Douglas Casa, CEO of the Korey Stringer Institute and a co-author of that original research, Dr. Christianne Eason of the Korey Stringer Institute, and Windee Skrabanek, head athletic trainer at Temple ISD in Texas, to walk through where this science actually came from and what it looks like applied at a real school. Here is what they covered.
The History of Heat Illness in High School Athletics
Between 1980 and 2009, there were 159 heat stroke fatalities among youth, high school, and collegiate players. Dr. Casa co-authored the 2018 study behind that number, with Andrew Grundstein and Yuri Hosokawa, mapping every one of those deaths against the WBGT recorded at the time and place it happened. In a sub-sample of 61 of those deaths, the pattern is stark: 100 percent occurred during conditioning drills, 97 percent of the victims were linemen, and 37 percent were being conditioned as punishment. On the map itself, the concentration is heaviest in the Southeast, and the dots representing hotter conditions at time of death are also the largest; very few fatalities happened in low-WBGT conditions.

It’s worth being precise about terminology here, since “heat stroke” isn’t the only outcome on the table. Exertional heat illness (EHI) is the umbrella term, and it covers four distinct conditions: exercise-associated muscle cramps, heat syncope (fainting), heat exhaustion, and exertional heat stroke, the most severe and the one that kills. Most heat-related emergencies never reach heat stroke, but the activity modifications built into WBGT policy are designed to catch problems well before they get there.
Severity doesn’t map cleanly onto temperature, either. Dr. Martin cited an athletic trainer who worked the Boston Marathon on a 50-degree day that still produced nine exertional heat strokes, and Dr. Casa noted that endurance sports see this pattern more often than football does, because a marathon sustains high intensity for hours with no built-in rest, while football practices already have some work-to-rest structure built in. Football’s risk instead concentrates almost entirely in one position.
Why Linemen Carry the Greatest Risk
Every recorded heat stroke death in high school football since 1995, where the player’s position was known, was a lineman, offensive or defensive. Dr. Casa explained why that position is so different from the rest of the roster:
“Linemen heat up faster. They cool down slower. Linemen should be doing different conditioning sessions than other players on the team. They should have longer breaks, and that break should be more often.
– Dr. Douglas Casa, CEO, Korey Stringer Institute
Larger body mass means more heat generated and less surface area to shed it through, a disadvantage no amount of conditioning fully offsets. Dr. Eason is currently developing a NATA position statement, recently covered by ESPN, aimed specifically at how linemen should be conditioned differently than skill-position players. The bigger issue, in her view, isn’t just physiology. It’s culture:
“It’s typically these conditioning sessions where someone dropped the ball, the coach is upset, and everyone has to get on the line and run, that we’re seeing these issues. We’re trying to shift the way we think about the culture of training these athletes who are at significant risk for heat illnesses.”
– Dr. Christianne Eason, President of Sport Safety, Korey Stringer Institute
The Georgia Study That Started It All
Dr. Casa was directly involved in the research that became the template nearly every state WBGT policy has since followed, and he walked through the full history behind it.
In 2005, Georgia had a heat stroke death, and state legislators responded by passing a law requiring every high school sports program to have a heat index policy. The law had a fatal flaw: it let each school write its own thresholds. Some schools set the bar so high, one as loose as 150 degrees heat index, that it would never actually trigger a change in behavior.
Ralph Swearngin, then GHSA’s executive director, saw the problem coming and, in 2008, launched a six-year research study across 28 Georgia high schools, spanning GHSA’s North, Metro, Central, Southeast, and Southwest regions. Athletic trainers at each school logged every exertional heat illness, from muscle cramps to heat stroke, against the WBGT recorded on each of those days, drawing on data from thousands of individual athlete exposures.

In 2011, two Georgia high school football players died of heat stroke while that research was still underway. Swearngin used the data already collected to establish the first statewide WBGT work-to-rest policy in the country, then kept the study running through 2014 to measure what changed. Dr. Casa described the result:
“This is definitely one of the most important field-based research studies I’ve ever been a part of. We blocked out four common WBGT: under 82, moderate risk 82 to 86, high risk 87 to 89, very high risk 90 to 92. And you can see, pre to post policy, a precipitous drop in the amount of heat illness, especially in these higher-risk ranges.
– Dr. Douglas Casa, CEO, Korey Stringer Institute
Where Does Your State Stand Today?
State policy today falls into three tiers: states that require WBGT monitoring outright, states that only recommend it, and one state, Idaho, that recommends heat index instead. California, Texas, Oklahoma, Arkansas, Louisiana, Mississippi, Illinois, Kentucky, West Virginia, Virginia, North Carolina, South Carolina, Georgia, Florida, Minnesota, New Jersey, and a cluster of Northeast states require it. Most of the remaining states, including Tennessee, fall into the “recommends WBGT” tier, meaning schools are required to have some heat safety policy but aren’t mandated to use WBGT specifically over other measurements. A handful of states, largely in the Mountain West and Northern Plains, along with Alaska and Hawaii, have no state-level policy at either level yet.
Dr. Eason explained why that distinction between requiring and recommending matters more than it might seem:
“When a state adopts a policy, it’s much more likely that a school will implement it. Adopting just means I’m telling you that you have to do it, but implementing means you’re actually doing it at the school.
– Dr. Christianne Eason, President of Sport Safety, Korey Stringer Institute
What is Wet Bulb Globe Temperature?
Ambient temperature, the number a phone’s weather app shows, accounts for exactly one factor: air temperature. It says nothing about how a body copes with exertion. Heat index adds a second factor, humidity, but the equation behind it was built around a man standing still in the shade in long clothing, not an athlete sprinting in direct sun. Neither measurement accounts for solar radiation or the additional metabolic heat a working body generates on top of the environment around it.
| Measurement | What it accounts for | Why it falls short for athletics |
|---|---|---|
|
Ambient temperature
|
Air temperature only. | Ignores humidity, sun, and wind. Two days at the same reading can carry very different risk. |
|
Heat index
|
Air temperature and humidity. | Built for a person walking in the shade in long clothing. Ignores solar load and wind, and athletes are not in the shade. |
|
Wet bulb globe temperature
Athletics standard
|
Air temperature, humidity, wind speed, and solar radiation. | It doesn’t. Measured on site, where the athletes actually are, which is why it’s the standard used by the military, OSHA guidance, and FHSAA. |
WBGT, developed by the military in the 1950s after repeated mass-casualty heat events at boot camps preparing troops for World War II, adds wind speed and solar radiation on top of air temperature and humidity, four factors instead of one or two. The gold-standard instrument uses a wicking wet-bulb sensor that estimates how effectively a person can actually evaporate sweat in the given conditions, which is the closest a single number gets to representing what a body experiences.
That number does not track ambient temperature the way people expect. A reading of 106°F in the New Mexico desert with 20 to 30 percent humidity produced a WBGT in the high 80s; a 90°F day in high humidity might produce a WBGT much closer to 90. The two numbers are not interchangeable and don’t correlate reliably with each other. Windee Skrabanek, who has run this policy at Temple ISD in Texas for three to four years since UIL adopted it, said the confusion shows up constantly in her community.
Heat Acclimatization
Research on heat illness by practice day, drawn from Périard, Racinais, and Sawka’s 2015 work, shows a sharp spike in exertional heat illness rate on day two of a new conditioning cycle, followed by a steep decline that levels off by around day 10. That pattern is exactly why national acclimatization guidance concentrates the strictest safety measures, no full equipment, no two-a-days, shorter sessions, in that first week: more than 90 percent of heat stroke deaths happen in an athlete’s first week of activity in the heat, and the risk isn’t limited to the start of a season. Any transition period, a return from spring break or the first days of any new conditioning block, carries the same elevated risk.
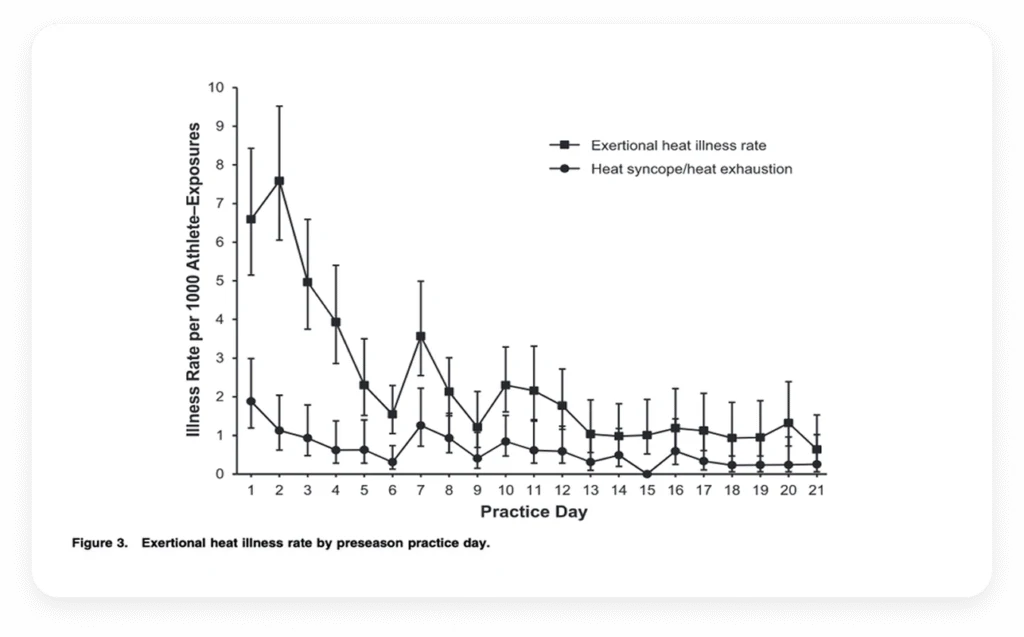
Dr. Casa pointed to a reason for that window beyond heat adaptation alone: fitness itself is the single greatest protector against heat illness, and the first week of a season is also the week athletes are ramping up their conditioning fastest. Where possible, getting fit before layering on heat exposure, rather than doing both at once, reduces the combined stress considerably. That logic extends to any athlete returning from illness, injury, or even a vacation spent entirely indoors in air conditioning; they’ve lost fitness and heat adaptation together, and need to restart at a lower volume rather than rejoin the team at full intensity.
Temple ISD tracks acclimatization with a low-tech system that works. Windee Skrabanek described it:
“We do wristbands, and each day is a different color wristband. If they showed up the first day, they all have a yellow wristband, which means they started day one. That way we’re tracking what days the kids were there. If they miss a day, we’re starting over.”
– Windee Skrabanek, Head Athletic Trainer, Temple ISD
One audience member added a detail worth repeating: acclimatization risk isn’t limited to sports most people picture. Marching band, and drum and bugle corps in particular, often practice for hours at a time on blacktop in heavy uniforms poorly suited to shedding heat, with fitness levels that vary far more than a conditioned football roster.
Building an Emergency Action Plan That Actually Works
An emergency action plan that only lives in an athletic trainer’s head, or in a document nobody has opened since it was written, isn’t a plan. Dr. Eason reframed how schools should think about ownership of one:
“Emergency preparedness is not something to do when the emergency happens. It should be something we build into a system before an emergency ever happens. It’s helpful to think of the emergency action plan as a system that belongs to the organization, not just a document that belongs to the athletic trainer.”
– Dr. Christianne Eason, President of Sport Safety, Korey Stringer Institute
Two elements matter as much as the plan itself: education and rehearsal. Coaches, trainers, and athletes all need to recognize the signs of heat exhaustion and heat stroke, and a whole-body cooling method, an ice tub, a “taco tarp,” or ice towels, needs to be easily accessible at every practice and contest venue, not stored somewhere that costs precious minutes to reach. The first ten minutes of a response are the ones that determine outcome, which is exactly why there’s no time to figure out a role for the first time while it’s happening.
Dr. Casa recommends rehearsing three distinct scenarios rather than one generic version: what coaches do in the first ten minutes when no athletic trainer is present at all, what happens when the athletic trainer is on-site but two or three minutes away at another field, and how the coaching staff supports the athletic trainer when one is right there, since very few athletic trainers can lift a 250-pound lineman into an immersion tub alone.
Cold Water Immersion: The Science of Cooling
Getting core temperature down fast is the single most important factor in surviving heat stroke. A comparison of cooling methods, drawn from research Dr. Casa co-authored establishing cold water immersion as the gold standard for exertional heatstroke treatment, ranks methods by cooling rate in degrees Celsius per minute. Ice packs applied to major arteries, a method Dr. Casa was taught in the 1980s and one still commonly assumed to work, sit at the bottom of that ranking, offering barely more than passive cooling. Ice water immersion sits at the top, and colder water immersed at greater body coverage consistently outperforms every partial-body method tested, including fans, wet sheets, and spray misting.
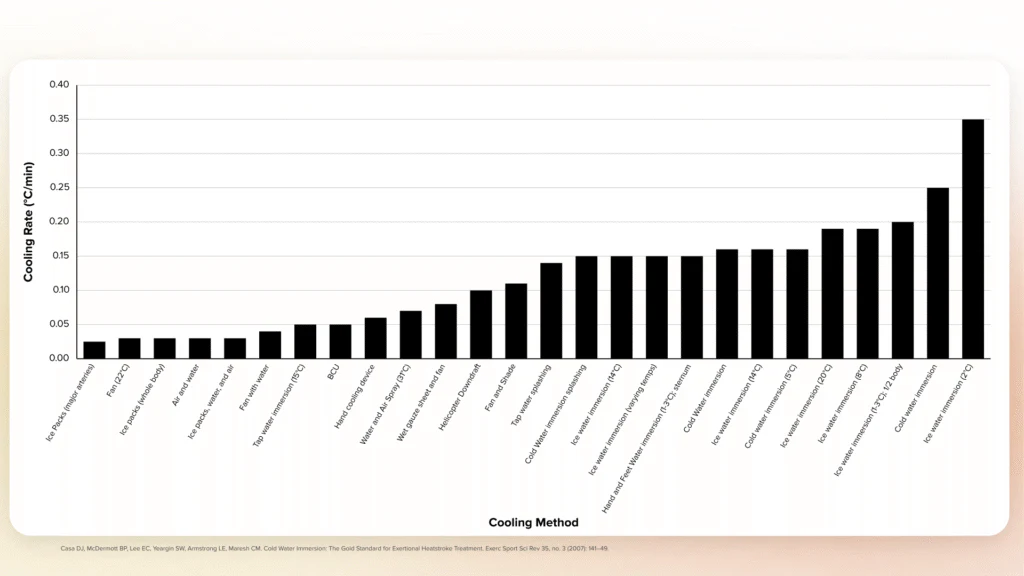
Dr. Casa shared additional data from a recent publication covering 464 heat stroke cases: the average starting temperature was 108°F, ranging from 105°F to 113°F, and outcomes were 100 percent survivable when temperature dropped under 104°F within 30 minutes.
“You can make it more effective with three things: get as much of the body in the water as possible, aggressively rotate the water, and use water as cold as possible, ideally under 50 degrees. Most people are in the tub somewhere between fifteen and twenty-five minutes. A really huge lineman might be in for thirty. A tiny cross country runner might only need ten.”
– Dr. Douglas Casa, CEO, Korey Stringer Institute
That range is exactly why a rectal thermometer, not a guess based on the clock, has to guide when someone comes out of the tub. A starting temperature of 112°F and a starting temperature of 106°F need very different amounts of time in cold water, and pulling an athlete out on a fixed timer risks ending treatment before their temperature has actually reached a safe level. Dr. Casa typically begins removing an athlete from the tub around 103°F, since skin temperature keeps dropping core temperature further even after immersion ends.
What Happens When Conditions Change Mid-Practice
A recurring question is what to do when WBGT crosses zones in the middle of a practice, up or down. Dr. Eason’s answer starts with a caveat: the goal is to have a written policy in place ahead of time so this decision isn’t being made live. Georgia’s own policy is explicit that whichever zone a practice starts in governs the entire session, even if conditions cool down later. The reasoning holds up physiologically: athletes have already been exposed to the more demanding heat stress, and extending a practice because conditions eased partway through adds stress rather than removing it.
Dr. Casa relayed advice from a colleague, Daryl Conway, at a recent NATA convention that reframes the question entirely: the better fix is not being in that situation to begin with. Checking the WBGT forecast before scheduling practice, and choosing a start time based on where conditions are headed rather than where they are at that moment, avoids the need to make an activity-modification call under time pressure once athletes are already on the field.
How Perry Weather Helps Schools Stay Compliant
Every requirement covered here depends on an accurate reading, at the right place, at the right time. A Perry Weather weather station carries a black bulb sensor, the same kind athletic trainers already recognize from handheld Kestrel devices, roughly twice the size and mounted permanently to collect WBGT data continuously rather than requiring someone to walk out and take a reading. Current conditions update every five minutes and are specific to the exact location of the station, not a nearby city’s airport reading.
Schools build policies directly around WBGT thresholds, with staff segmented by group, coaches, athletic trainers, band directors, so each group only receives the alerts relevant to them. A threshold crossing triggers an automatic notification, and schools can attach their own activity guidelines directly to that message, so a coach who receives an 86-degree WBGT alert also sees the specific rest-break and equipment requirements tied to it, not just the number. The same platform tracks lightning strikes down to the second using the National Lightning Detection Network, along with wind, precipitation, cold stress, and air quality, and a forecast view lets schools plan a practice window around where conditions are headed rather than reacting once they arrive. A team of in-house meteorologists is available directly to answer questions about any of it.
Perry Weather is currently running a limited-time offer of 10 percent off for both new and existing customers, valid on hardware purchases and software upgrades.
If you want to see what automated WBGT and severe weather monitoring looks like on your campus, get a quote today.
How do you handle WBGT moving between zones during practice, up or down? If you’re in yellow and it moves to orange or red, do you stick with that zone, or does the clock reset?
Have a written policy in place beforehand so this isn’t decided live. Georgia’s policy is explicit: whichever zone practice starts in governs the whole session, even if conditions later ease. If a practice starts in a hotter zone and cools down, don’t extend it to “make up” lost time — athletes already absorbed that heat stress, and adding time only adds more.
How effective is the TACO method for rapid cooling, and how does it compare to a stationary cold water immersion tub?
A cooling rate of 0.15°C/minute is linked to 100% survival and minimal complications from exertional heat stroke; below that, both death risk and long-term complication risk rise. Systematic reviews put TACO’s (tarp-assisted cooling with oscillation) rate at roughly 0.14–0.17°C/minute — effective, when done right. The catch: it takes several people to hold the tarp so water doesn’t spill, plus someone keeping the water moving (the “oscillation”). So it’s a strong alternative when a full tub isn’t available, especially off-site, but not necessarily easier.


