


The Problem: Project Leaders Are Stuck Manually Logging Weather
Proving a weather delay shouldn’t be this hard, or this manual.
Yet, every week, construction teams waste hours on manual readings, clipboards, analog rain gauges, and weather apps that cannot store or export a single day of history.
When a delay happens, you’re left scrambling with NOAA data that doesn’t match your site.
Perry Weather’s Historical Reporting replaces that mess with automated, site-specific, defensible weather logs tied to your exact policies, so you can stop wasting time on manual reporting.
Here’s how to get your time back, protect your crews, and document every delay, automatically.
What You’re Really Up Against: How Manual Data Costs You Time, Money, and Credibility

Project leaders aren’t asking for “more reports.” They want answers:
- How do I prove weather caused this delay?
- How do I show we followed protocol without digging through clipboards?
- How do I stop wasting hours pulling logs for GCs, owners, or OSHA?
- How do I document every lightning stand-down or heat delay without relying on NOAA’s erratic weather feeds?
Without automated weather tracking, here’s what usually happens:
Denied Change Orders Without On-Site Proof of Delays
- The Problem: When lightning or other weather conditions stop work, you need bulletproof documentation to secure change orders. But GCs often pull public NOAA data from airports miles away—data that doesn’t reflect your jobsite conditions.
- The Impact: Without hyper-local, on-site proof, your claim is denied. Your company is forced to absorb the cost of the delay.
Wasted Hours on Manual Data Entry
- The Problem: Leadership wants a recurring report to review project timelines, but instead of focusing on risk, you’re buried in Excel, reconciling manual lightning delay logs and scribbled notes.
- The Impact: This manual effort wastes valuable time that could be spent on-site, managing actual risk. It’s a high-cost, low-value time sink.
No Defensible Audit Trail for Compliance or Insurance
- The Problem: An incident occurs. OSHA wants proof that you were following your heat illness prevention plan on July 18. Your phone app doesn’t store history. Your manual log is a guess at best.
- The Impact: You walk into OSHA, workers’ comp, or insurance reviews without the documentation needed to protect your team and your organization.
The result? You lose time, money, and credibility trying to recreate the past instead of preventing the next risk.


The Fix: Defensible Historical Data That Does the Work for You
Perry Weather’s Historical Reporting lets you capture, store, and share weather safety data across every project. It provides defensible data that isn’t just accurate and auditable, but also:
Automated
No more chasing down manual logs or NOAA data. Perry Weather collects accurate data for the duration of lightning delays, WBGT & heat index, rainfall, wind speed, AQI, and more, without human input.
Timestamped and Tamper-Proof
Each reading is logged with the exact time and date and is based on your emergency action plan. Once it’s captured, it’s locked. No backdating. No guessing.
Tied to Your Weather Safety Policies
Every alert is tied to your exact weather safety policies: whether that’s lightning within 10 miles, heat index above 100°F, or a wind speed threshold that triggers a halt in work.
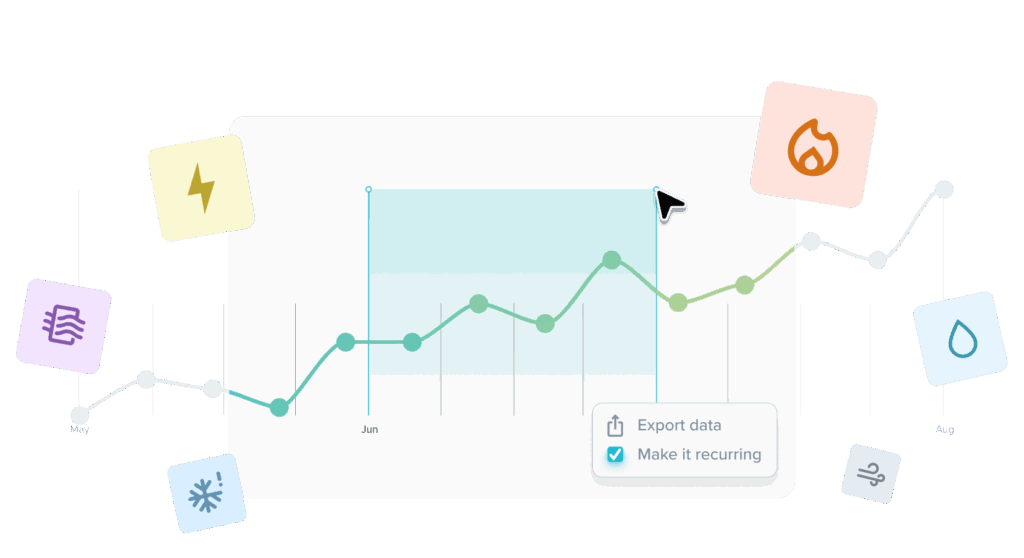
Easily Exportable
Schedule recurring exports by day, week, or month. You can hand a clean CSV to your GC, auditor, insurer, or OSHA without having to manually pull a report every time.
Site-Specific
Data comes from your on-site weather station, not a public weather station 20 miles away.
What used to take hours every week across multiple jobsites now takes minutes. You get one consistent, reliable source of truth.
Traditional Manual Logs vs. Perry Weather
| Use Case | Manual Weather Logs | Perry Weather |
| Change Orders & Delay Claims | Airport data can be inaccurate and easily challenged. | Hyperlocal sensor data proves exact time, date, and site conditions. |
| OSHA/insurance investigations | No audit trail leading to fines, citations, reputation risk | Time-stamped, read-only records show you followed policy. |
| Internal Reporting | Manual entry work eats hours | Automated, centralized reports across all sites |
Phone apps and forecasts weren’t designed for your jobsite. They don’t track real conditions. They don’t know your policies. And they won’t hold up when you’re filing a change order or proving compliance.
What Proof Looks Like with Perry Weather
Perry Weather helps you document, defend, and prove every decision you make.
Let’s say you’re asked to explain what happened on July 18:
- “Show me proof that you were in a lightning stand down between 1:00 PM and 4:00 PM.”
- “Prove to me your crew followed your work/rest policy.”
- “Show the exact time you paused work due to high winds”
If you’re relying on manual logs, you’re already on the defensive. And if you default to NOAA data, good luck justifying why it said 0.1″ of rain while your site was underwater.
With Perry Weather, you’ve already got the receipts:
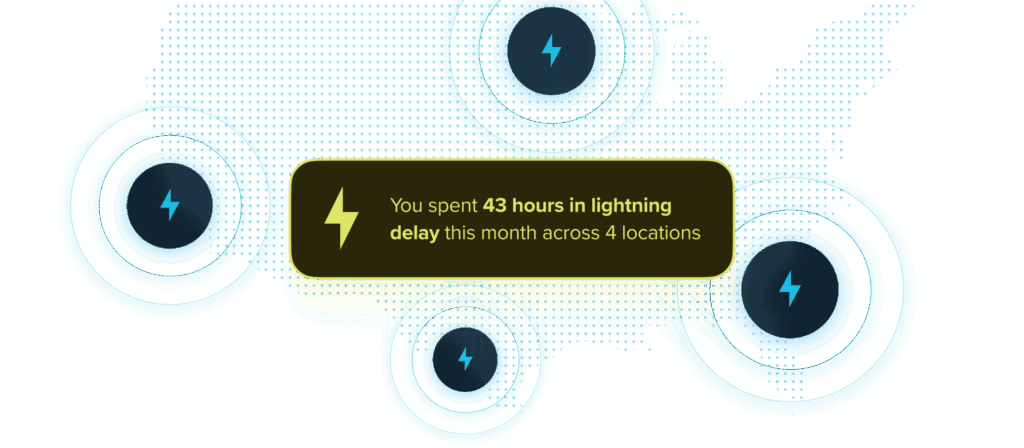
- Lightning Delays: Know exactly how many minutes your site was under delay.
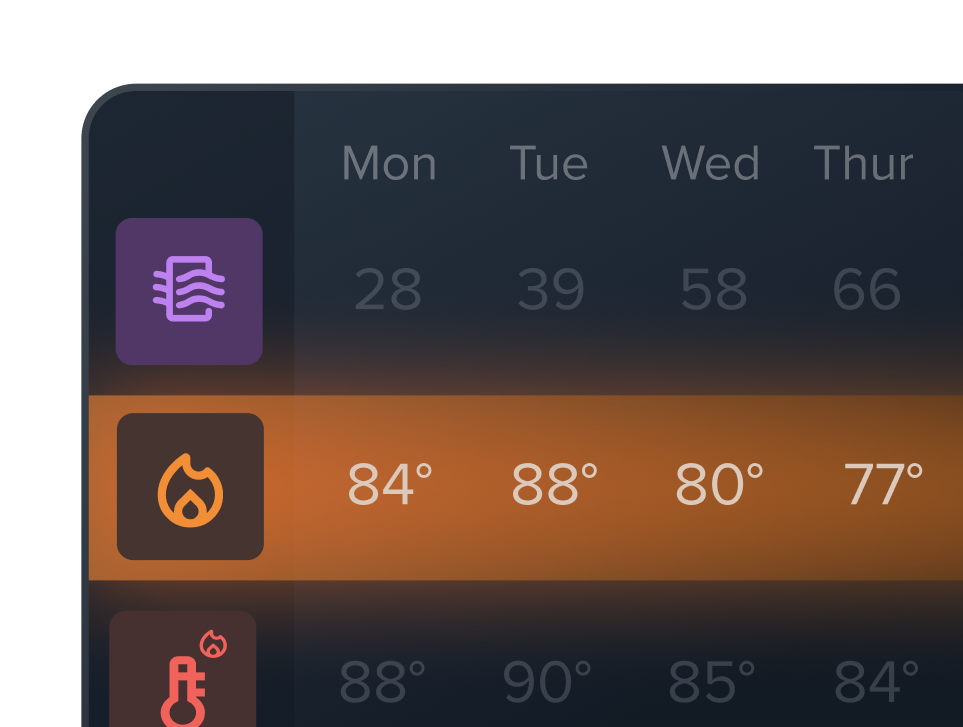
- Heat Protocols: Show precise WBGT and heat index readings and prove your policy was followed.
- Custom Rules: Pull logs based on your actual policies, not generic weather alerts.
Perry Weather automates the entire process for you, logging every data point, alert, and policy trigger, straight from your jobsite.
The result: Fewer disputes. Faster reviews. Tighter margins.


How Historical Reporting Works: Two Powerful Tools in One
Perry Weather’s Historical Reporting works by combining two powerful tools in one. Together, they give you the full picture of what happened and how your team responded.
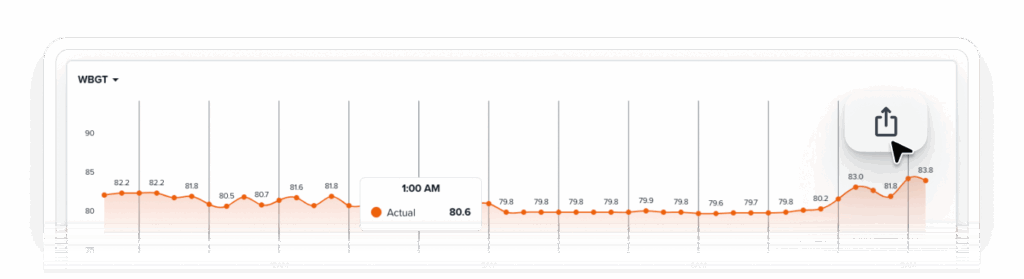
Weather Conditions: Your On‑Site Defensible Alibi
The question it answers: “What were the conditions?”
Perry Weather’s weather station logs real-time data on-site. From lightning distance and heat stress to wind gusts, AQI, and more, every data point is recorded automatically.
This allows you to:
Export Custom Time Ranges & Intervals
Select any date range and choose 15-, 30-, 60-minute, or 24-hour intervals.
Filter by Operating Hours
Remove the noise. Export a report showing only the conditions for your 7 AM-5 PM shift.
Automate Recurring Reports
Automatically send a daily, weekly, or monthly report to your leadership or compliance teams.
Export Accurate Values
Pull precise average, maximum, or minimum values to fact-check conditions and support audits
When OSHA, an insurer, or GC asks for the temperature at 2:45 PM, or the wind speed before a crane lift, you can export it instantly and even instantly schedule daily, weekly, or monthly exports to deliver audit‑ready reports straight to leadership.
Policy Activity: Your Downtime Weather Delay Receipt
The question it answers: “How long were we really down? And why?”
While the Weather Conditions Report shows environmental conditions, Policy Activity ties live, on‑site conditions to your exact policy thresholds to show how the weather impacted your operations and—critically—for how long.
When conditions cross a threshold, the platform automatically logs:
- Start time
- End time
- Total policy duration
- Which policy triggered it
You can now quantify:
- Lightning stand‑downs down to the minute
- Heat exposure in Red/Black WBGT zones for heat policy compliance and justifying work/rest schedules.
- Wind gusts above your crane work or lift limit
- See when rainfall exceeded policy thresholds
- AQI violations for respiratory hazard tracking
Together, Historical Reporting gives you the answers to what happened, Why it mattered, and the receipts to prove it.


Frequently Asked Questions
How do I prove weather delays to a client or insurer?
To prove weather-related downtime to clients, you need time-stamped, site-specific weather delay documentation.
Perry Weather tracks every delay event, like lightning stand downs or WBGT breaches, and logs the exact start, duration, and clearance.
Exportable reports give you proof in seconds.
What counts as defensible weather data?
Defensible weather data must be:
- Captured on-site (not from a forecast or airport)
• Time-stamped and immutable
• Linked to your exact safety thresholds
Perry Weather’s Historical Reporting meets all three requirements. WBGT, heat index, lightning proximity, wind gusts, and rainfall are recorded continuously and stored as read-only historical data for any compliance review.
Why isn’t NOAA or a phone app enough to justify a delay?
NOAA data comes from airports and regional stations, which can, on many sites, be miles away and significantly off from your jobsite conditions.
Phone apps don’t store history and cannot export defensible logs. Perry Weather solves both gaps by recording hyperlocal, on-site conditions in real time and storing everything in your Historical Reporting dashboard for future audits or disputes.
How can I reduce weather disputes with documentation?
Disputes arise when weather-related shutdowns aren’t clearly documented. Perry Weather provides audit-ready lightning weather reports and policy activity logs where every delay is backed by clear data and automatic time tracking—leaving no room for argument.
What should a weather audit trail include?
A complete weather delay audit trail should show:
- The site-specific weather conditions (WBGT, heat index, wind speed, lightning distance)
- The policy threshold that was triggered
- Timestamps for when the delay began and ended
- A record of who received alerts and when
Perry Weather automates this entire chain. It becomes your weather safety system of record, simplifying compliance, billing, and insurance conversations.
How does Perry Weather automate heat stress logs for OSHA compliance?
Instead of relying on handheld sensors and manual entries, Perry Weather uses automated WBGT logs tied to your weather policies.
The system tracks your heat stress thresholds, triggers alerts, logs every event from your site in real time, and stores it in your historical weather reporting dashboard for future audits or reviews.
Can Perry Weather track time in a lightning delay?
Yes. Using lightning detection from the National Lightning Detection Network, the platform logs when lightning enters and leaves your safety radius and calculates total minutes in lightning stand-down.
You’ll have clean proof for every invoice, lightning weather report, or audit.
How does Perry Weather save time on weekly or monthly reporting?
Most EHS teams spend hours manually pulling NOAA files, checking handheld heat sensors, and stitching together timelines for project leadership. Perry Weather removes that workload entirely by letting you schedule automatic exports daily, weekly, or monthly.
You Can’t Stop Weather Delays. But You Can Prove You Made the Right Call.
You can’t control the weather, but you can control the proof behind every delay, shutdown, and safety call.
Stop wasting time on phone apps, clipboards, and spreadsheets. Start using a system that gives you proof, without the panic.
Perry Weather’s Historical Reporting gives you:
- Bulletproof documentation of every delay for change orders, backed by hyperlocal conditions
- Automated recurring reports, without spending hours pulling logs across multiple sites
- Confidence that your policies were followed
- A defensible record for workers comp, insurance, and compliance, including exactly how many minutes your project spent in lightning stand‑down
Turn every shutdown into clear documentation, every policy trigger into a timestamp, and every question into a one‑click export.
Your job is accountability. We give you the receipts.
Try Perry Weather free for 14 days — and stop losing hours and change orders to bad documentation.


